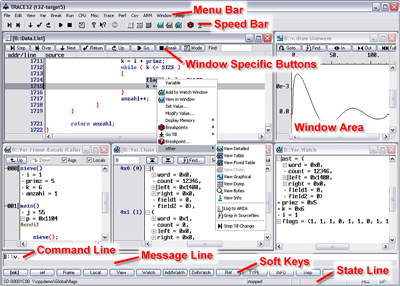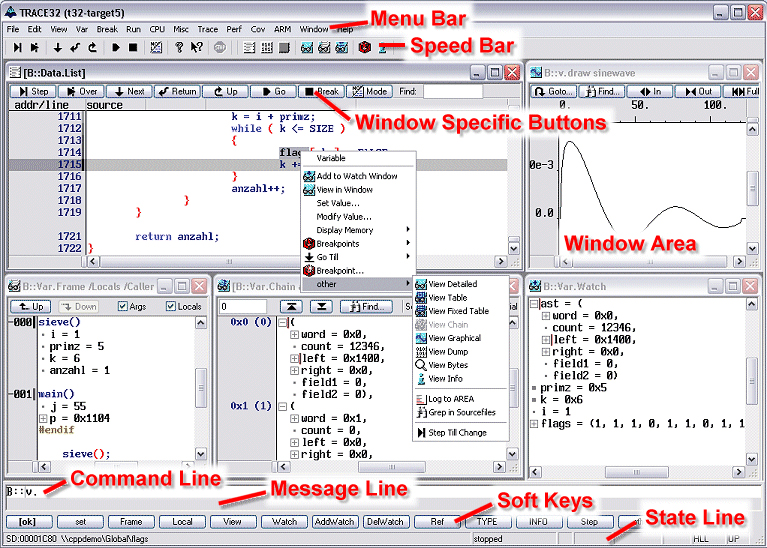
High-Performance Interactive User InterfaceAll commands can be entered by the keyboard, the function keys or with the mouse. Universal Window System Windows of any size can be created and positioned anywhere on the screen. In each window there is a horizontal and a vertical scroll bar. Up to 128 windows may be open simultaneously. Windows may either be static (contents fixed), dynamic (contents variable) or temporary. Dynamic windows are updated at a rate of up to 300 times per second. Workstation based software uses the same graphic elements like the host operation system. Window Configuration Save and Restore FacilityEach window configuration that the user designs can be saved for later reuse. Several user predefined configurations can easily be selected from the keyboard by switching the window pages. 5 Screen AreasFor interactive operation, the screen is split into several areas:
|
|
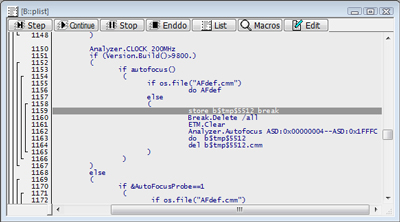
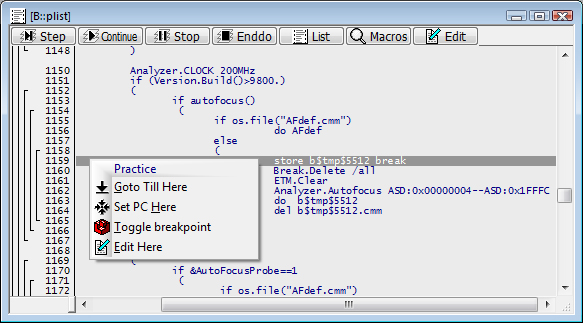
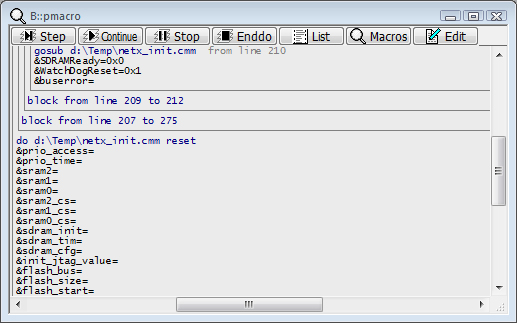
Special Test Language for Automatic Test and BatchTRACE32 has it′s own special BASIC-like meta-language called PRACTICE II which is a superset of it′s fundamental commands. Complete programs may be constructed using PRACTICE II for automatic testing or for the construction of command macros. All aspects of the systems may be controlled/programmed via the PRACTICE language FunctionsAll important characteristics of the system can be accessed by the PRACTICE language functions. In particular the PRACTICE program can be used to automatically enter target data Practice Command Words
Structured ProgramsPRACTICE is a highly structured language. Local and global variables may be used. One module (file) may call another. Practice DebuggerA powerful Debugger for debugging Practice Programs is included.
|
 |
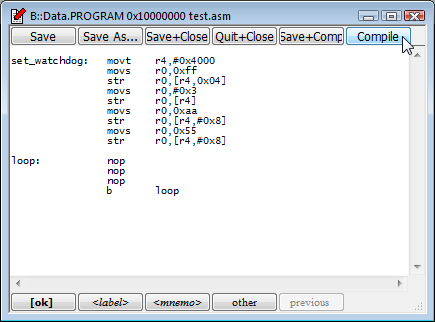
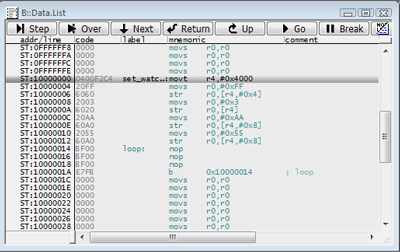
Low Level Debugger FunctionsEspecially for testing of Prototypes, Trace32 serve a lot of Functions and Commands. Page-AssemblerA built in Page Assembler can be used for create small Test-Code directly in the Target. The Page Assembler is used on the same way as a editor writes in a Document. The Compile Button generates the Assembler-Code to the Target. Memory-Test an CPU-Cycle GenerationDifferent Commands are available for create Patterns to the Memory or for Memory Test's. The Command can generate exactly defined CPU-Cycles in endless loops for measurement with Oscilloscopes or Logic-Analyzers in the Target. Peripheral HandlingThe complex Peripheral Parts of the Device is handled by a powerful Peripheral Window. The Window shows the Status of the Peripheral content and refresh the Data continuously. The Window is used for show and change the Peripheral on Bit Level. The Window is defined with a special Language and the Engineer can create additional Windows (e.g. for FPGA) himself. Flash-ProgrammingTrace32 supports programming of parallel and serial Flash devices in different technology (NOR and NAND).
|
|
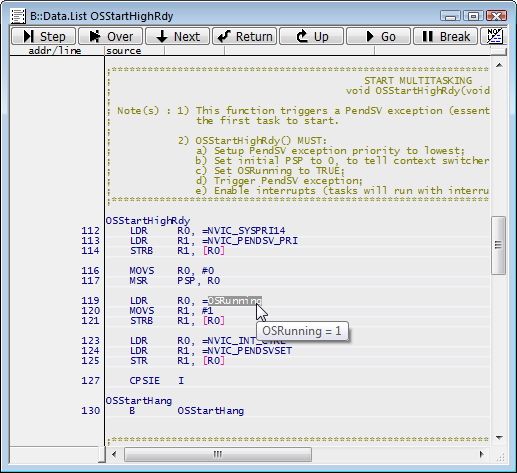
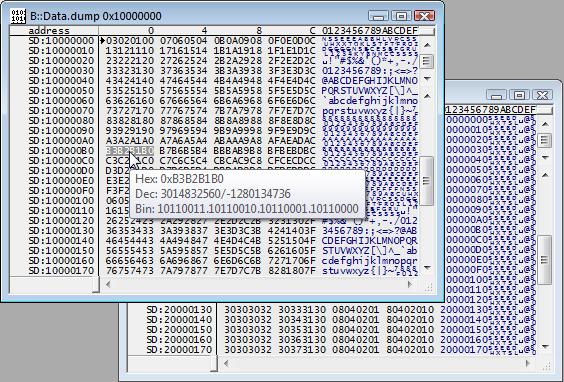
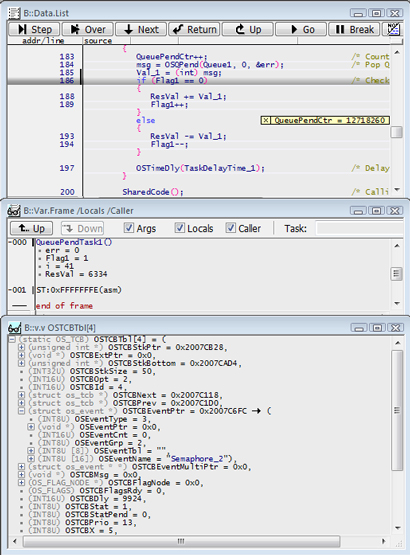
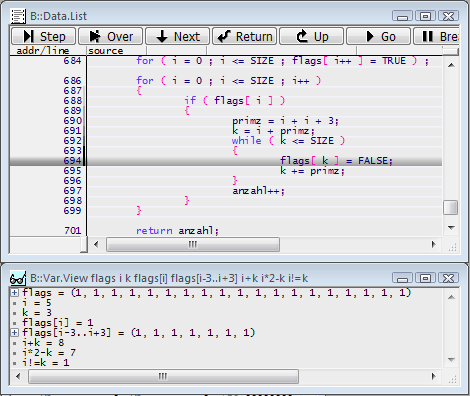
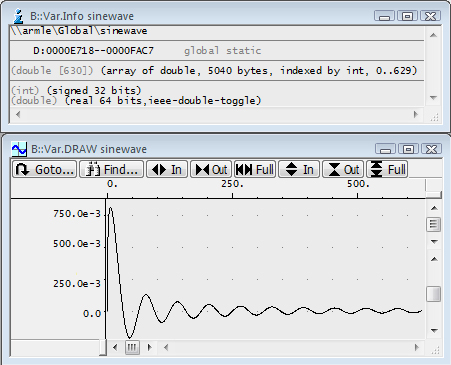
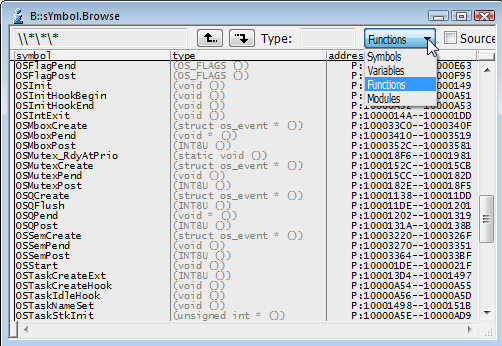
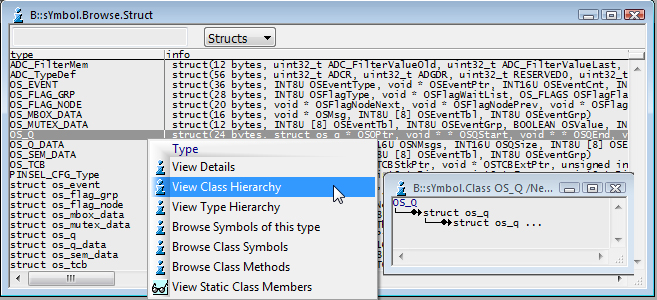
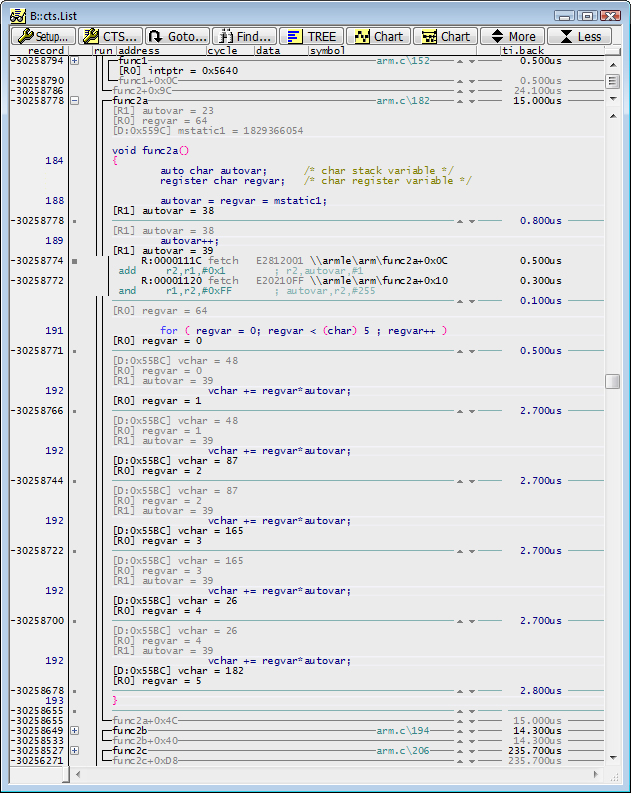
Very Powerful and fast High-Level Language DebuggerC, C++, JAVA, PASCAL, PL/M, ADA or MODULA2 Debugger with very flexible handling of Variables. Every Object in the Window can be change by simple Mouse-Click. Show quickly Values by click to the Object in the Source-Window. Create multiple additional View Windows with complex Objects and Terms. Special Windows for Table or Linked List's. Graphic Display of Arrays. Scaled Variable View (e.g. the Value of a AD-Converter can convert and scaled for Display as a mVolt Value). Direct Functions for DebuggingGo to Read/Write Access on Object by a simple Mouse-Click. The Command-Parser supports 64Bit C Syntax. The Access to Struct's or C++ Object works on the same way as in the Language. Multi-Core / Multi-Processor DebuggingDebugging support for Asymetrical [AMP] Multiprocessor and Symetric [SMP] Multi-Core / Multi-Processor Targets. Powerful Symbol ManagementA important part of the Debugger is the Symbol-Browser. With the Browser, every Object of a Project can be access on a easy and quickly way. The Command-Line Parser use the Symbol Browser in the background for filling the Parameter automatically. GroupLarge Projects can be separated with free defined Group's. Every Group have a Color and can optional remove form the Symbol-Database (e.g. Kernel ). LoadersThe Debugger loads the Compiler Debugging Format directly. Trace32 supports all popular Compiler Formats like ELF, COFF, UBROF, ROF, OMF, COSMIC .... |
 |

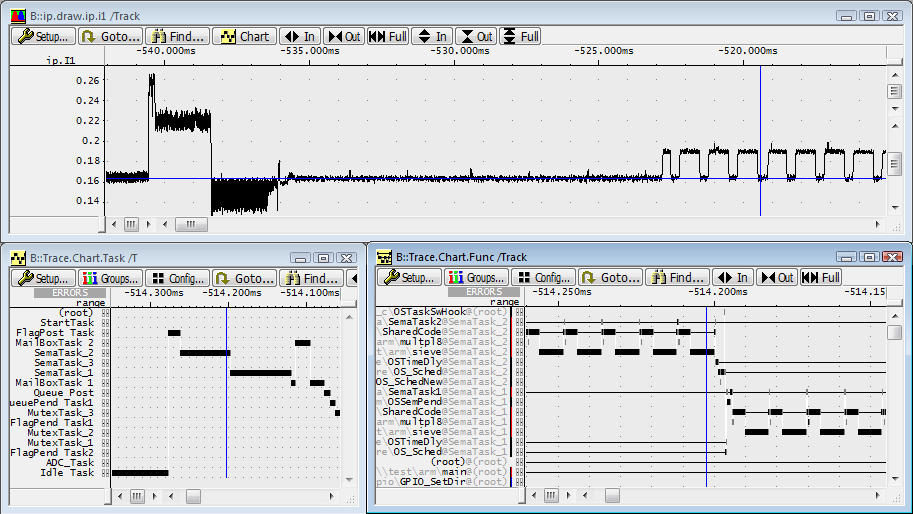
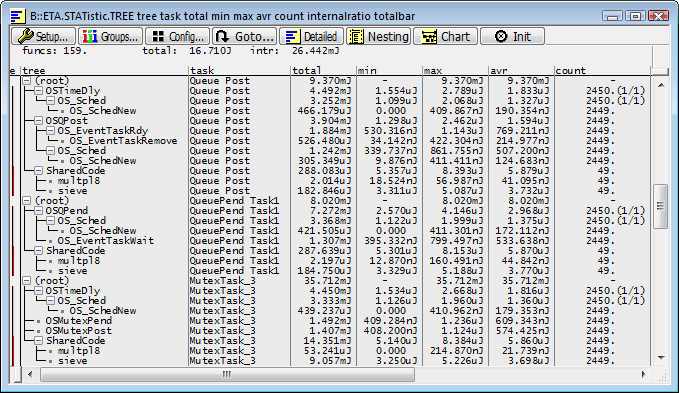
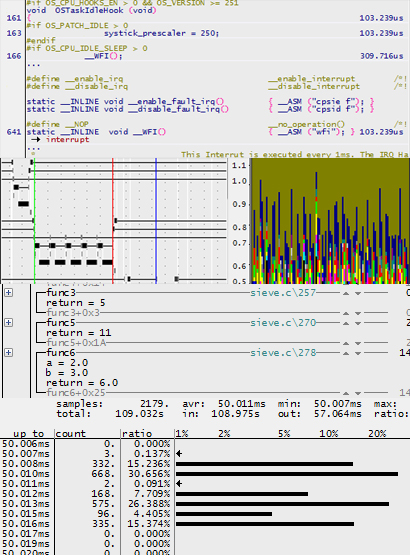
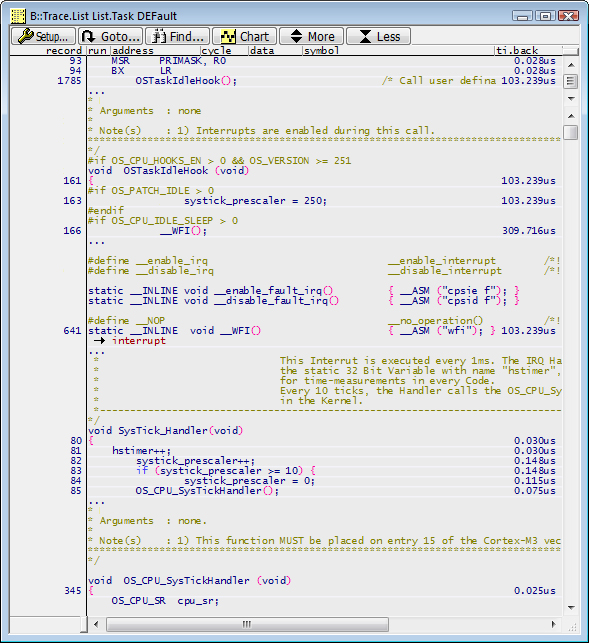
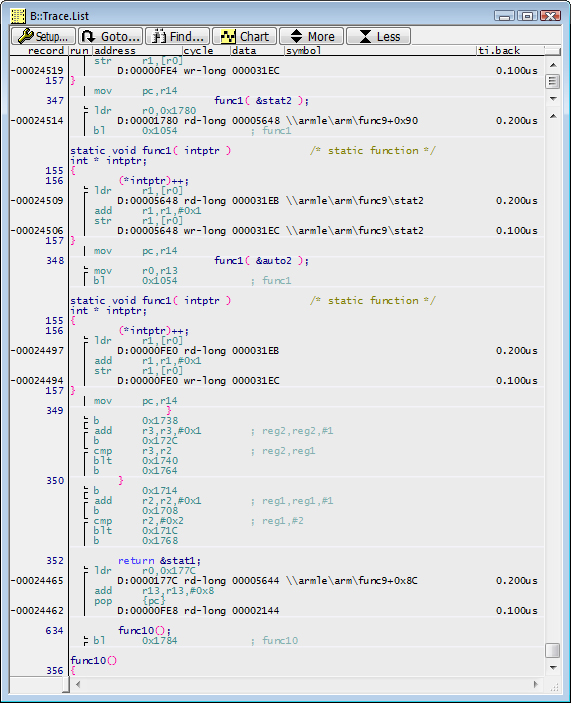
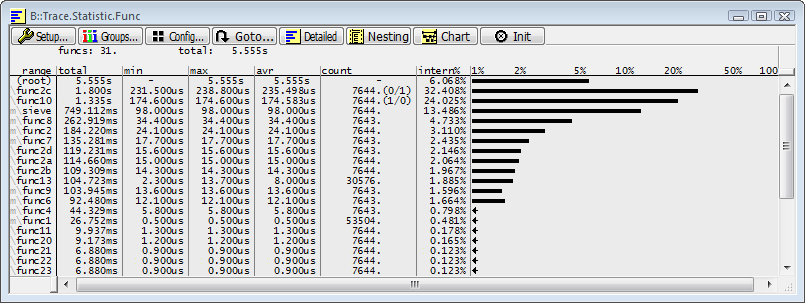
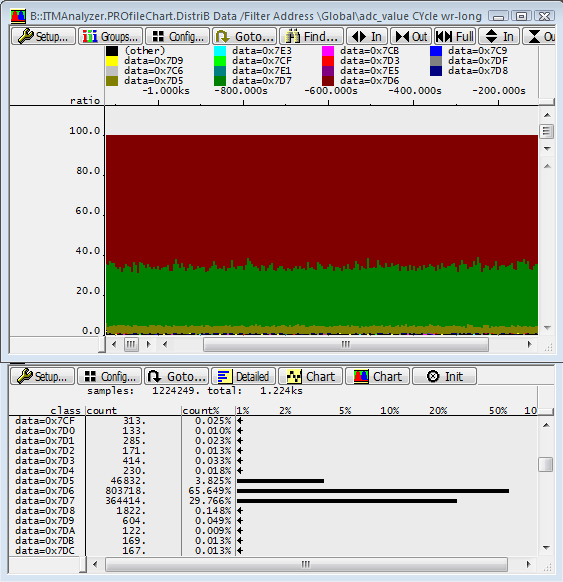
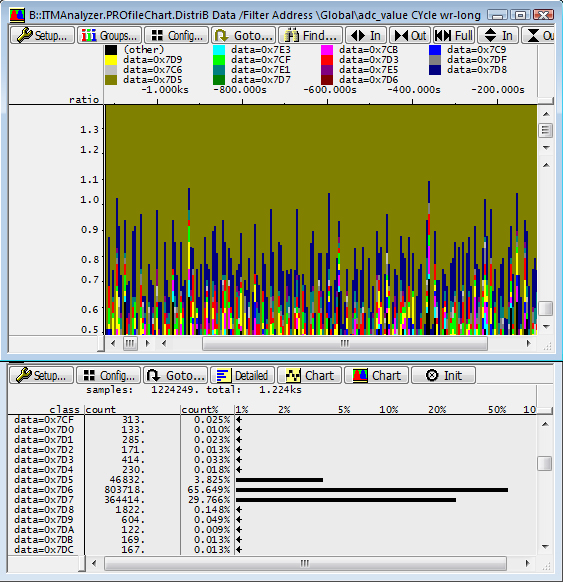
Code- and Data-TRACELauterbach offers different Trace Systems for On- and Off-Chip Trace. Bus-Trace, Parallel and Serial Flow-Trace Systems for the most Devices on the Marked. The Trace-Hardware supports the highest Speed and have a automatic Adaptation to the Target Timing. Powerful SoftwareThe traced Data can be analyze in very different and powerful way. The Focus to the Traced-Data is define from Assembler-Level up to Task-Level in Listing- or Chart-Windows. Free placed markers, directly in the source, can be used for create Time-Measuring-Points (e.g. for Loop- or Code-Reapeat/Runtime analyzing).This measurement, include the placement of the Markers, is done after the Code has traced. Context-Tracking-SystemIn the past it was necessary to spend a lot of time analyzing the trace listing in order to find out which instructions, data or system states had caused malfunctioning of the target system. Statistic FunctionsA lot of Functions are available for create Statistics over the traced-Code or Data. Powerful Chart and Draw Windows are helpful for analyze Code-Timing or Data-Flow. Time-CorrelationAll Trace-Systems are time correlated to the other. Is a Timing-, Logic- or Protocol- Aanalyzer attached, then the Trace Memory of each System is time-correlated. A Mouse click in a Trace-Data-Window will positioned all other Windows to the same Time-Position. |
 |
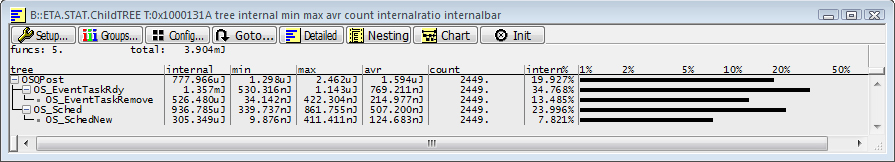
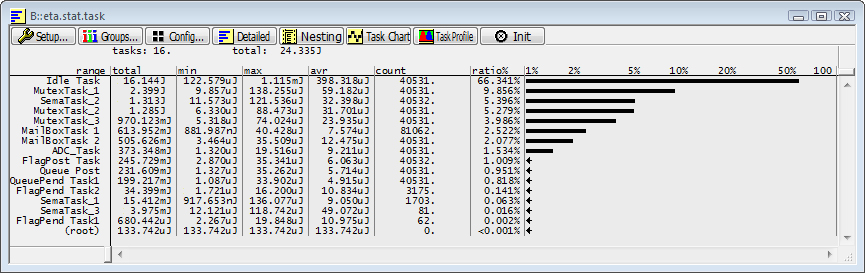
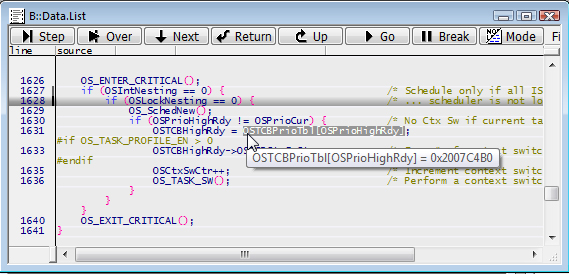
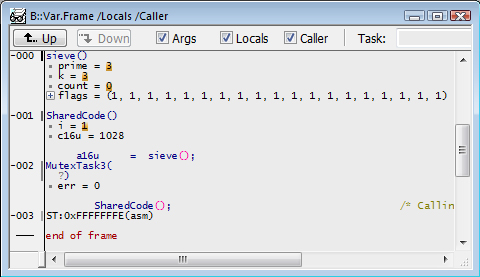
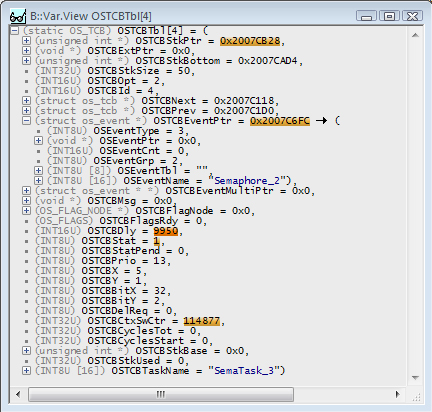
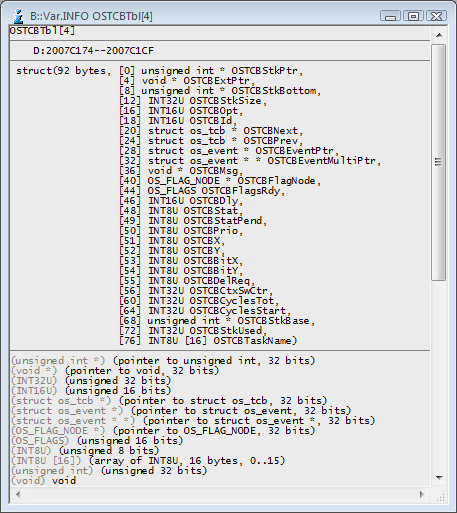
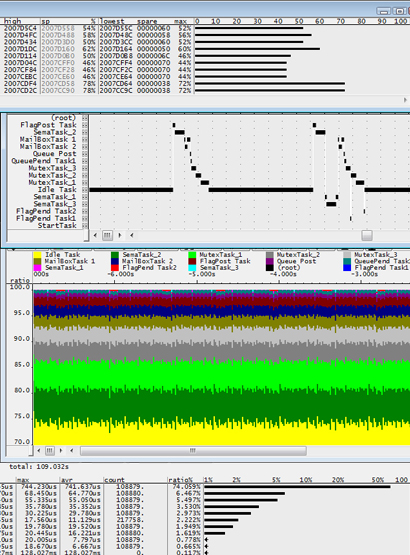
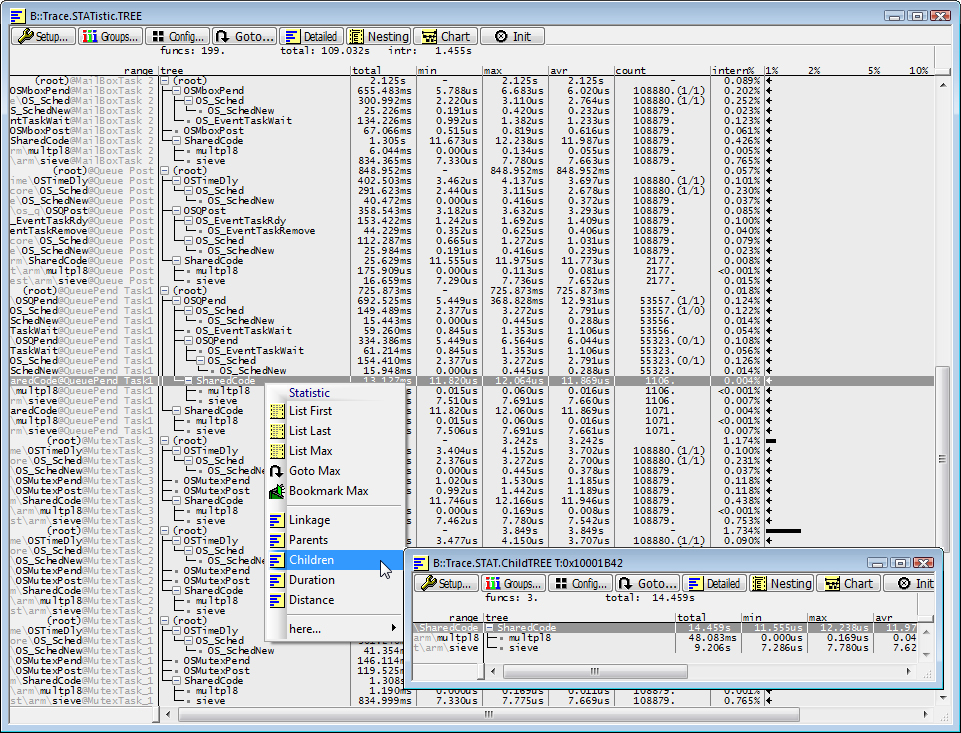
RTOS Kernel DebuggingA very important part of a Debugger - Trace - System is the Kernel Awareness. With this Extension, the Tool can understand the Kernel activity. The Lauterbach Kernel-Extension have the advantage, that it not influence the Target in any way. Dynamic Symbol relocatingIn Target with MMU's and dynamic Memory allocation, the Kernel awareness supports the Debugger-MMU and relocate the Symbols to the location of the Process. Kernel Status ViewDifferent Windows shows the Status of the Kernel, and the Event- Objects. In the case, that the CPU-Device supports Live-View, the Kernel Awareness use the Trace32 Hardware for refresh this Windows up to 100 times per Second. Task-Switch Information in the Trace-DataImportant for all nesting based Trace-Functions e.g. Function Statistic or Function Call-Tree or Call-Chart Windows, the Debugger must be see the Task Switches. This is a additional, important Job of the Kernel-Awareness Extension.
All Example on this Page are made with uC/OS-II on a Cortex-M Device.
|
|

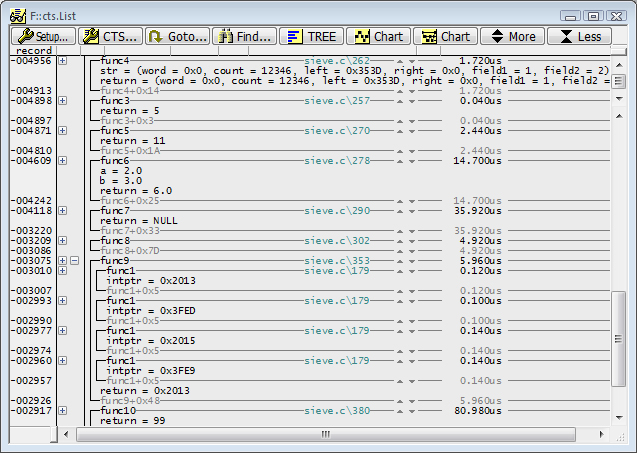


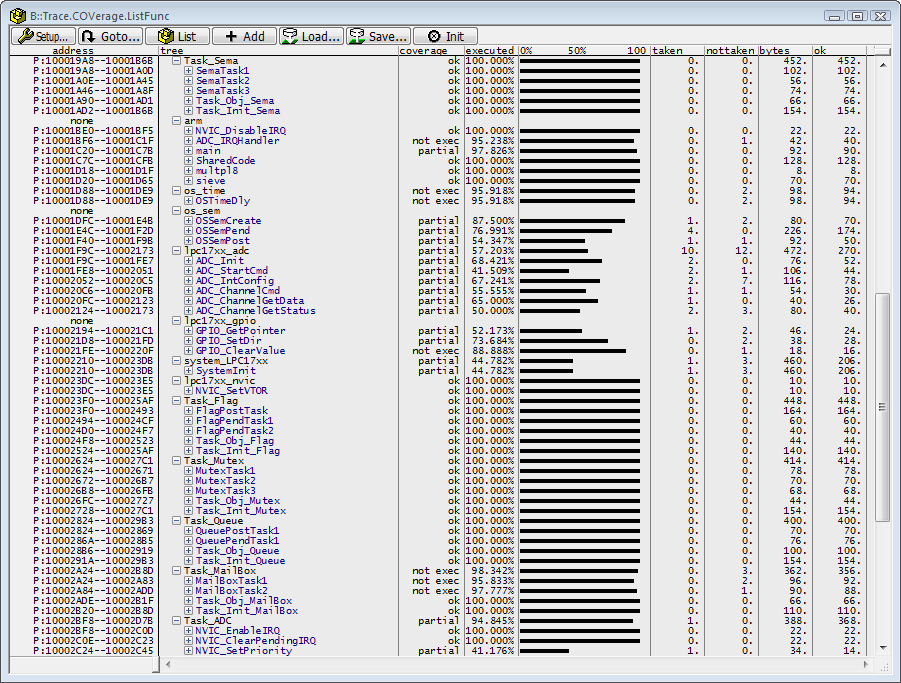
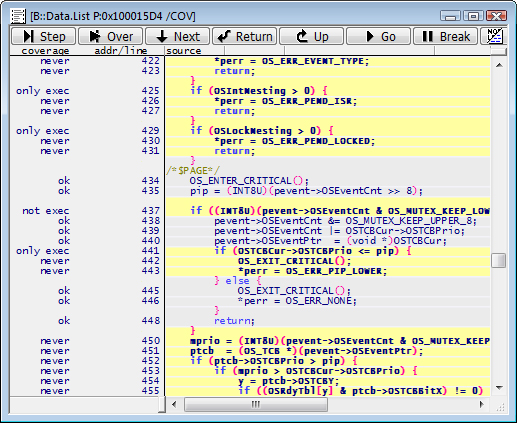
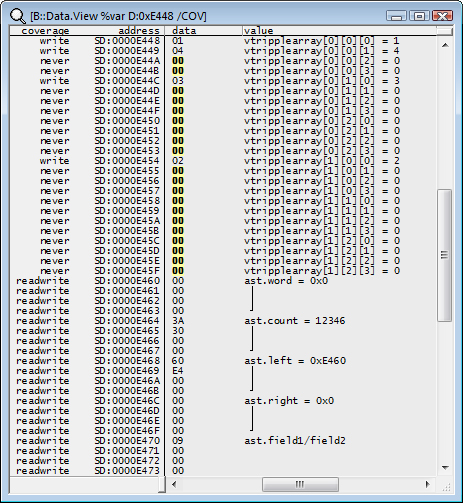
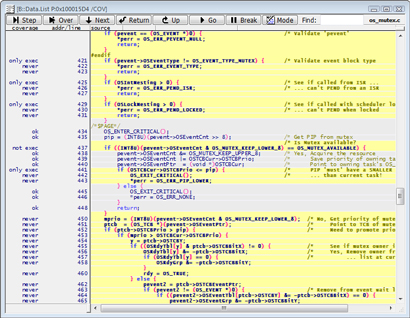
Code and Data CoverageThe Code and Data-Coverage is very helpful for test and check your Project. It gives the Answer to the Questions "Is my Code tested completely". Depending of the Device, Trace32 offers C1- Code and Data Coverage. Conditional Branch analyzingEach conditional Branch has tree state:
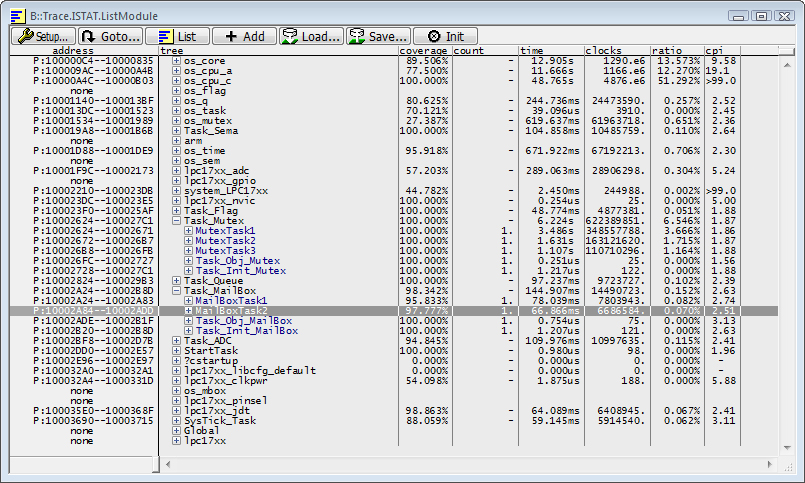
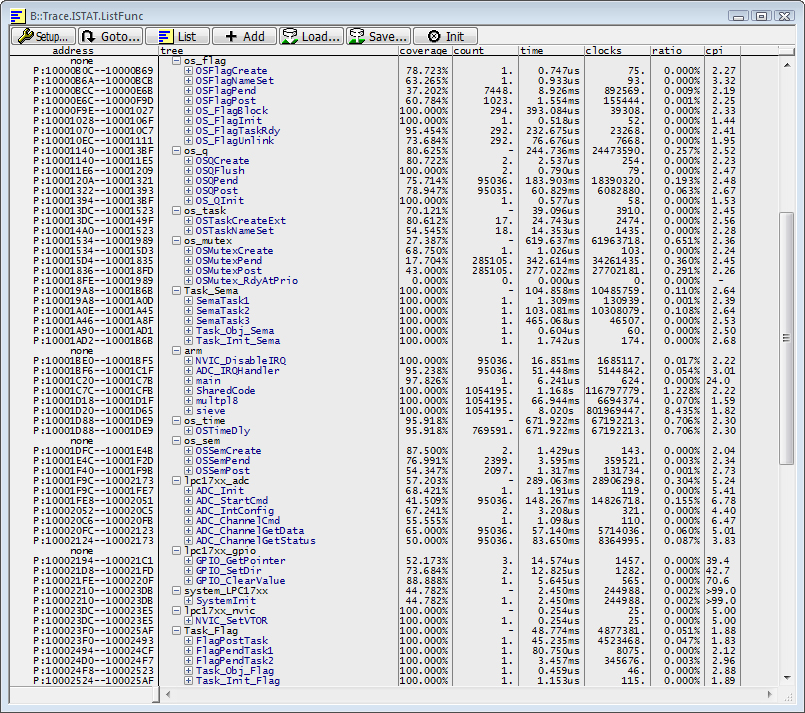
Instruction-Statistic CoverageThe additional Instruction Statistic Coverage is a Trace-Post Analyzing and shows the count, and used Time for each HLL-Line. It is helpful for Bug-Finding and Performance-Analyze.
|
|
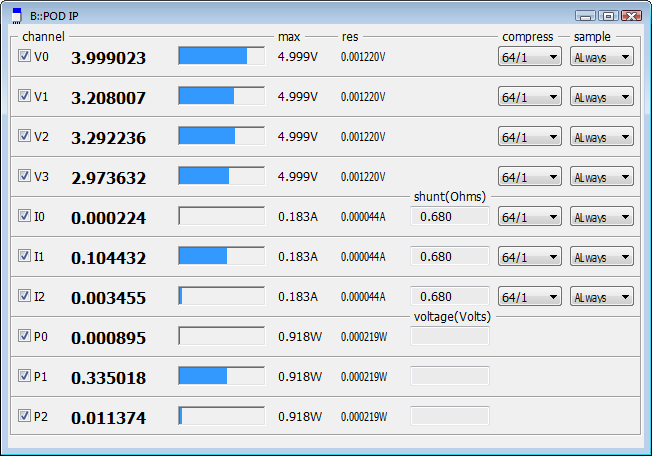
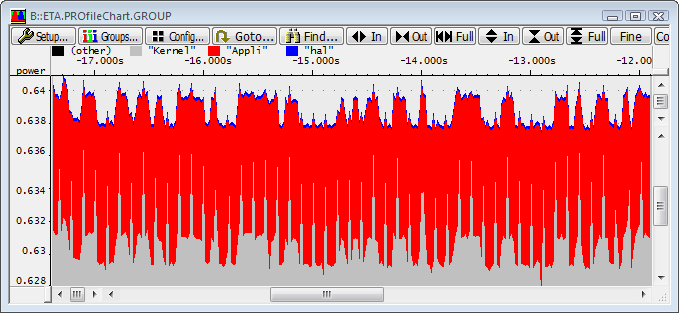
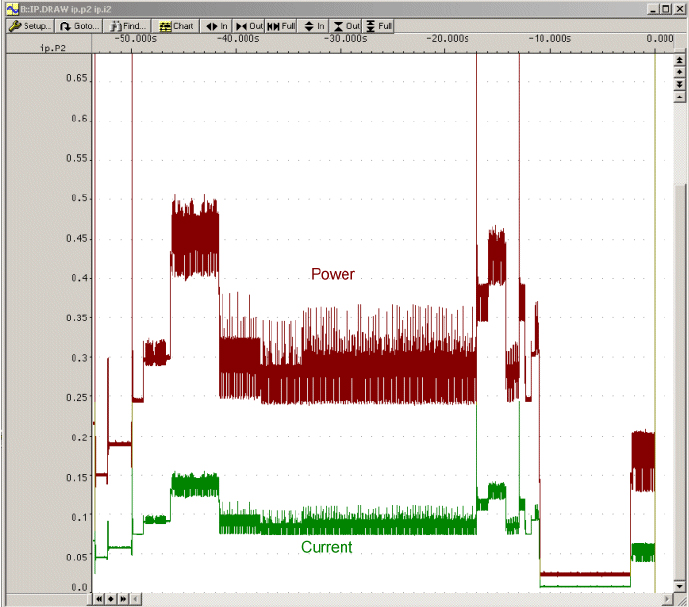
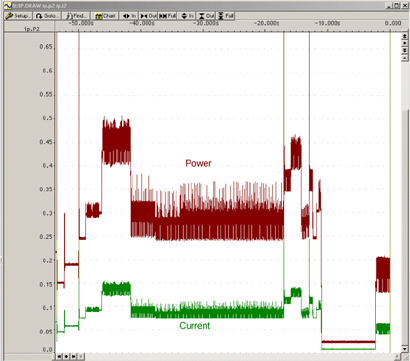
Energy optimizationReducing energy consumption is becoming more and more important for the development of battery powered devices. Characteristics such as stand-by or operating time are crucial for the operation of equipment like mobile phones. Hence comprehensive measures for reducing energy consumption are an integral part of designing battery-powered devices.
However, an optimal reduction of energy consumption can succeed only if the software that controls the equipment consistently exploits all possible power-saving features of the hardware. Energy is the product of current, voltage and time. Each of these parameters can be influenced by the control software.
This kind of checks require a test set-up that measures, records and analyzes the program and data flow of the control software as well as current and voltage gradients. Additionally all these recordings have to be related to each other in a simple way. |
 |
coming soon |
coming soon |