Trace32 Modular Debugger / Trace Concept

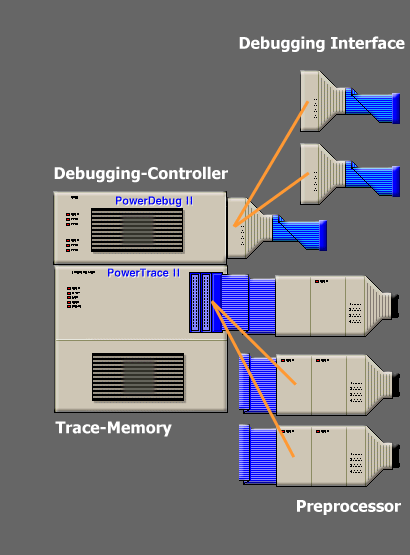
The Hardware of a Trace32 System is segmented in different Modules. The Basic Modules can support more than 4000 different Device at this time. Your a free in the choice of the Compiler or Kernel. The most of your investment is target independent.

Trace-Memory are available for small (256MByte) up to large 8GByte, or endless streaming to Host, if this is posible by the Device-Speed...

Two Hardware-Parts are Target-dependent. One is the Debugging Interface for connecting to the Debugging Port. The other is the Trace-Preprocessor. This unit supports a complete Trace-Techniques like ETM or NEXUS for example.

The look and feeling of the Software for all Devices and Debugger / Trace / Logic-Analyzer Configuration is always the same. A Change between the Tool's can be made without learning new Commands.


DebTraceConcept


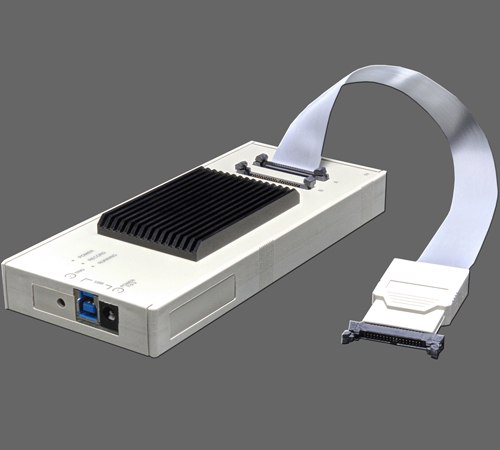
DEBUG-E40 + CombiProbe
Debugging System with 512MByte Trace Economy
with USB-3 Interface


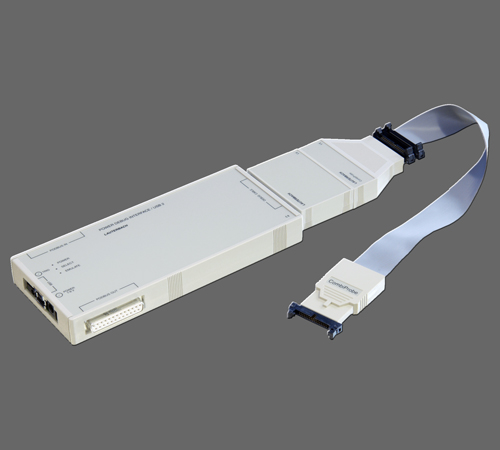
The Debugging Controller USB-3 is extended with the CombiProbe. This Unit supports 4 Bit Trace with the MIPI Standard up to 200MBit/s
If the Host System is fast enough, then Endless Trace by real-time streaming is possible. Additional one Analog-Probe can connect to this System for energy optimization.

The Hardware can be loaded with Debugger and Trace License for ARM, MIPS, PIC32, Atmel, Infineon (DAP-Streaming).


CombiProbe


ARM CORTEX-M Debugger with 256MByte Trace
USB-3 Interface to Host

Special designed Hardware for Cortex-M Family. Supports all Cortex-M Devices. by SWD, cJTAG, JTAG and 4 Bit ETMv3 Trace.
The Hardware contains 256 MByte Trace Memory including TimeStamp Unit for OffChip Trace, up to 200Mbit/s per Channel.

Key-Features are:

Basics
  • supports more than 1000 different Cortex-M Devices
  • free choice of Compilers, and RTOS
  • running with Windows XP,Vista,7,8, PC-Linux and Mac-OS
  • JTAG, cJTAG and SWD support
  • MIPI-10, MIPI-20 and Standard 20 Pin JTAG (14 Pin TI also)
  • 0.3 to 3.3 Volt support (5V tolerant)
Debugger
  • C/C++ Debugger
  • InLine- and Page- Assembler for small Tests
  • Pattern and Memory Test Functions
  • continues Refresh off all Windows with RealTime-Access
  • simple and complex Breakpoints (Hardware / Software)
  • Peripheral-Windows for view and change Peripheral
  • Flash-programming support
  • OS-Kernel support
  • AMP multicore debugging (Option)
Trace
  • 4-bit ETMv3 support in continuous mode
  • ITM via TPIU and serial Wire Channel
  • Multicore Trace support
  • statistic Functions for runtime of Tasks, Module and Function
  • statistic Functions for point to point runtime analyzing
  • 2 channel Data - statistic support
  • Chart and Profile-view of Task, Module and Function runtime
  • Nesting Tree-Analyze with Children- Cal- and
    Duration-analyzing
  • C1 Code-Coverage incl. Documentation
  • Trace Streaming to Host (up to 100mBit/sec with USB3) for
    longtime Trace.
  • endless Trace analyzing (Code Coverage) during runtime.
  • Energy Analyzing (3 channels U,I) with optional Analog-Probe


 PowerTrace-II


POWERTRACE-X50 + Trace-Memory Extension
Debugging System with up to 8GByte Trace
with 10/100/1000 Ethernet and USB-3 Interface


Develop-System with up to 8 GByte Trace-Memory. Supports all Debugging and Trace-Techniques up to 600MFrames/s and up to 6,25Gbit/s per Lane on HSSTP Ports.
Additional a 16 Channel Timing Analyzer is available with time correlation to the Main-Trace System. On this Timing-Analyzer, one Analog-Probe can connect, for energy optimization.

This System support all additional Tools like the Timing Analyzer PowerProbe, the Trigger-Probe, the small LogicAnalyzer PowerIntegrator-I, or the large PowerIntegrator-II.


PowerTrace-II